


The Appraisal, June 2025 — Index Performance Updates & Ten Trending Topics

Welcome to the June edition of The Appraisal, a newsletter on real estate tech. My writing focuses on the 30+ public companies operating at the intersection of real estate and technology. In this edition, we’ll review the Real Estate Tech Index’s recent performance and highlight several recent stories across the real estate ecosystem.

The Real Estate Tech Index has been quite volatile through the first half of the year — up nearly 15% in February, followed by a sharp pullback in April, and a recovery in May and June (now down 2% year-to-date). The Trump administration’s tariff actions drove much of the April sell-off, which spiked 10-year treasury yields (currently at 4.4%) and threatened to further increase construction material costs (which are now 40% higher compared to February 2020).
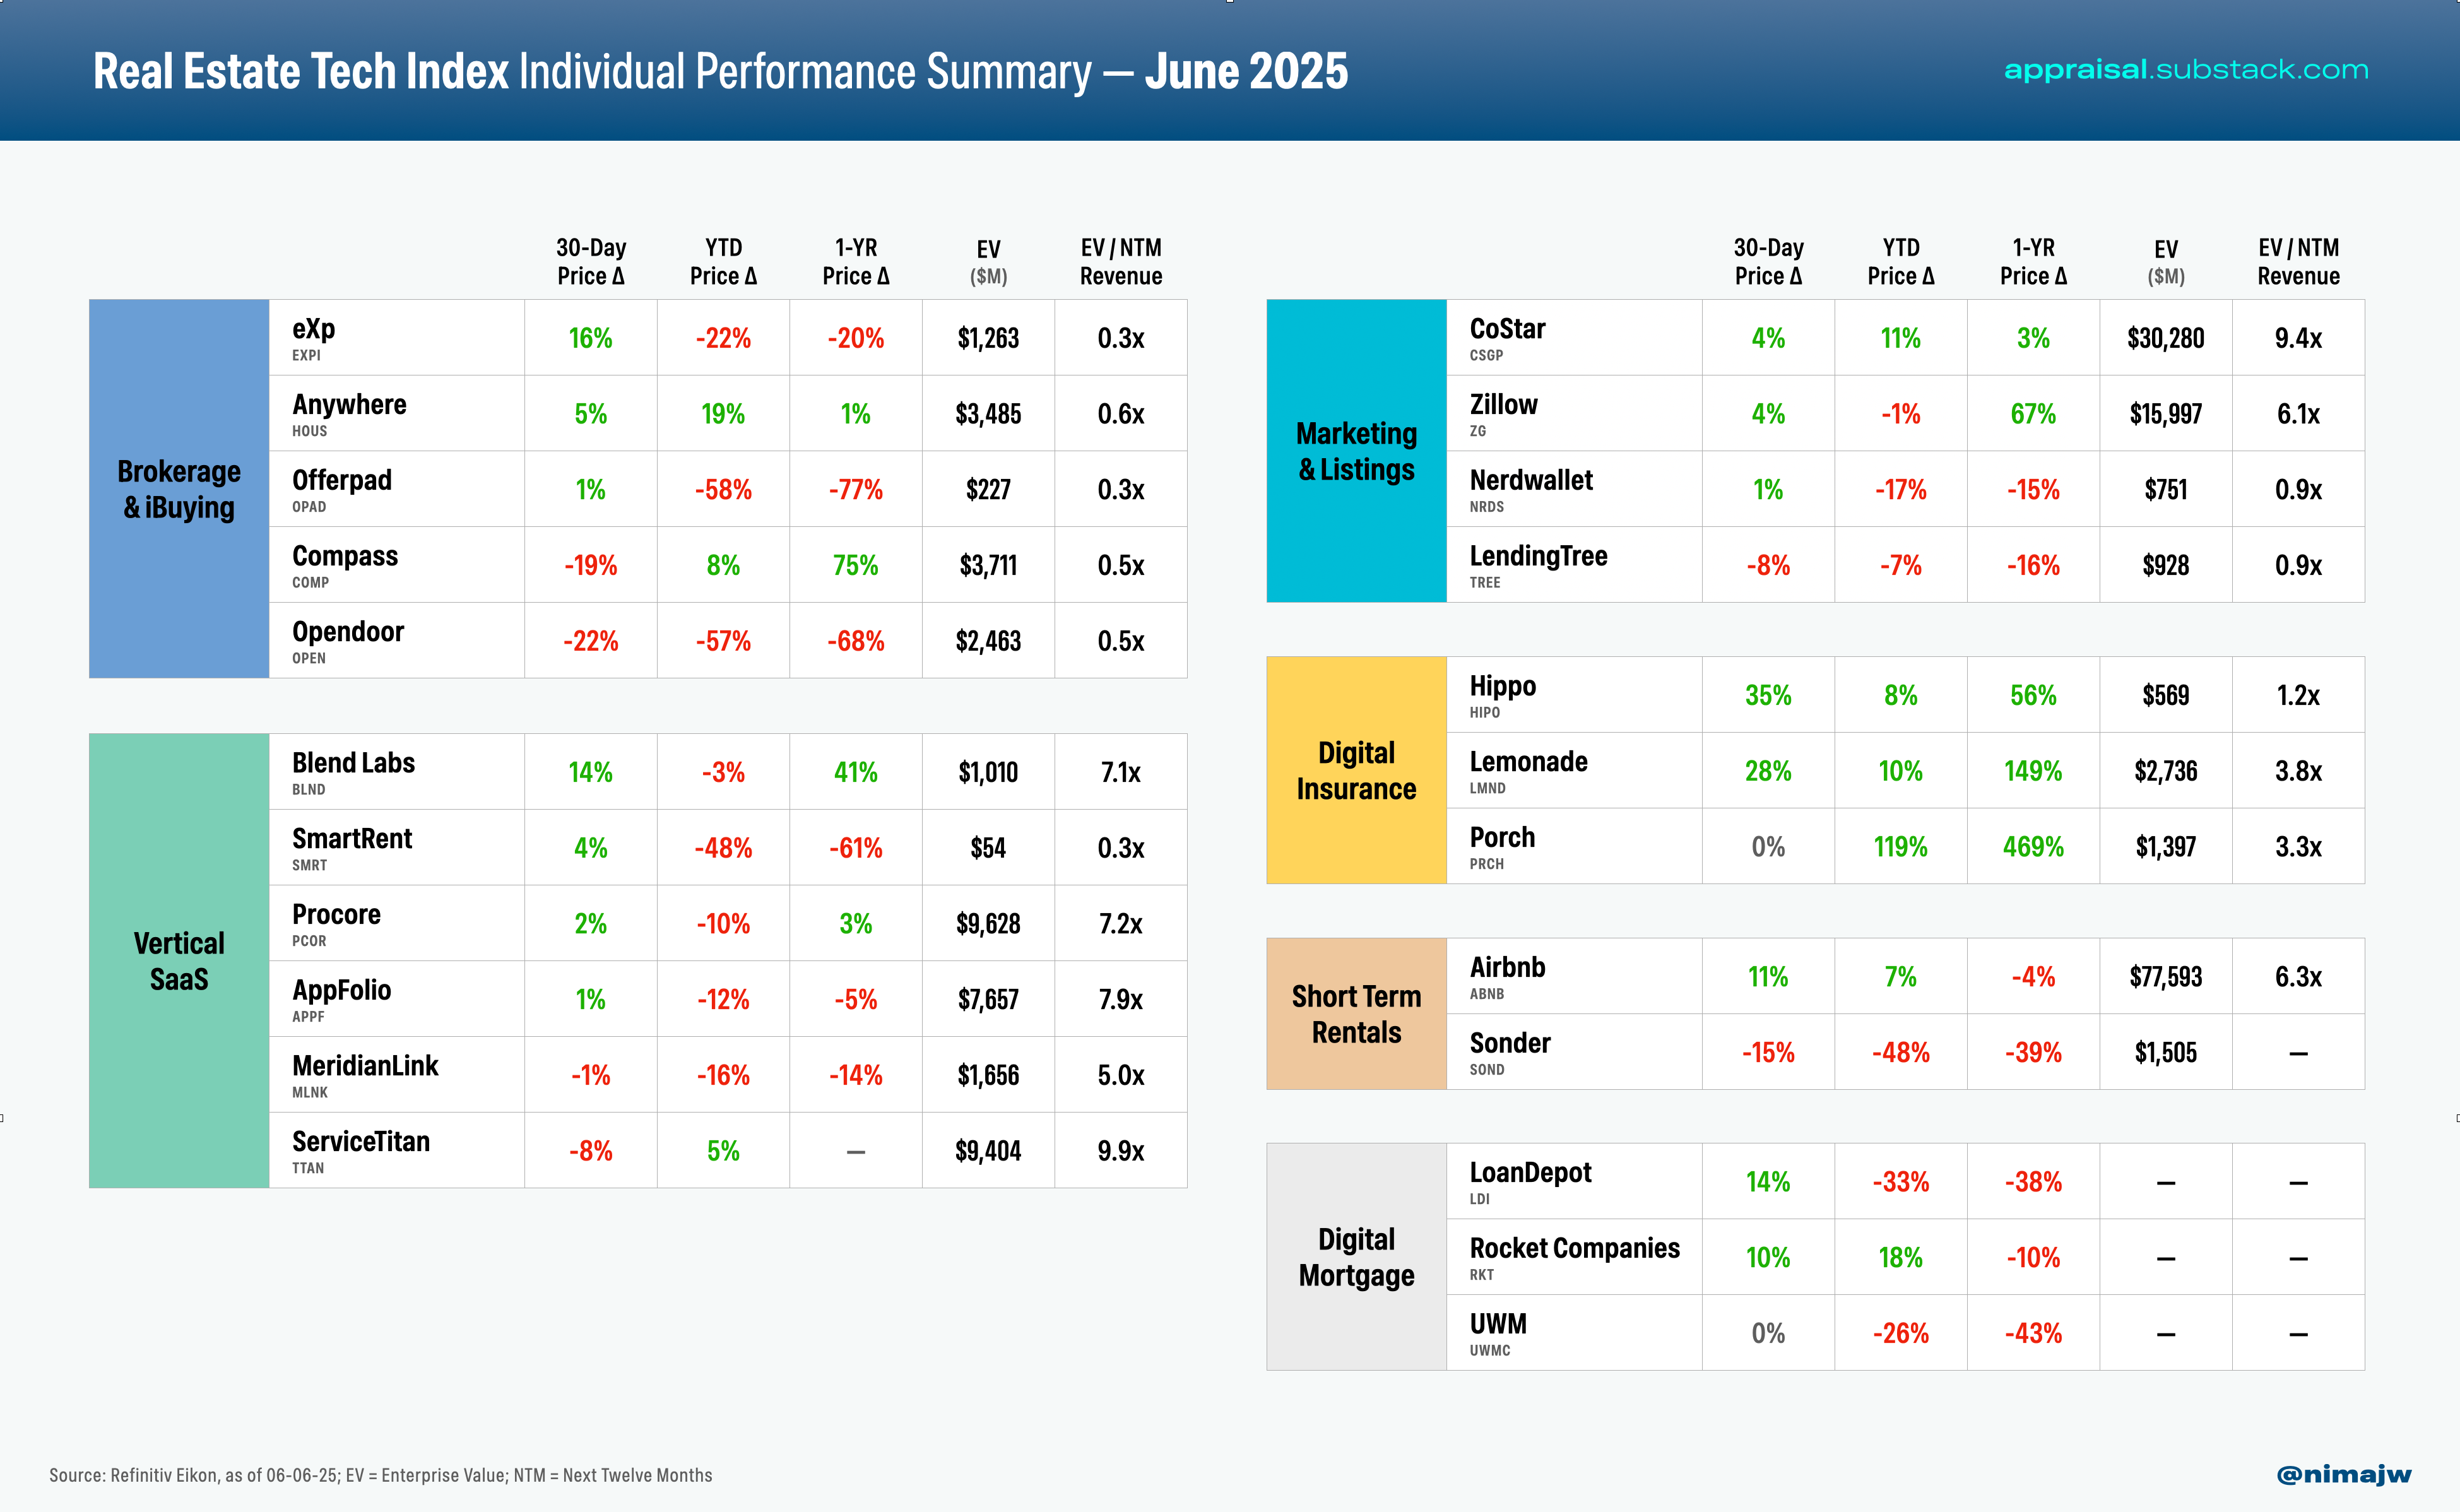
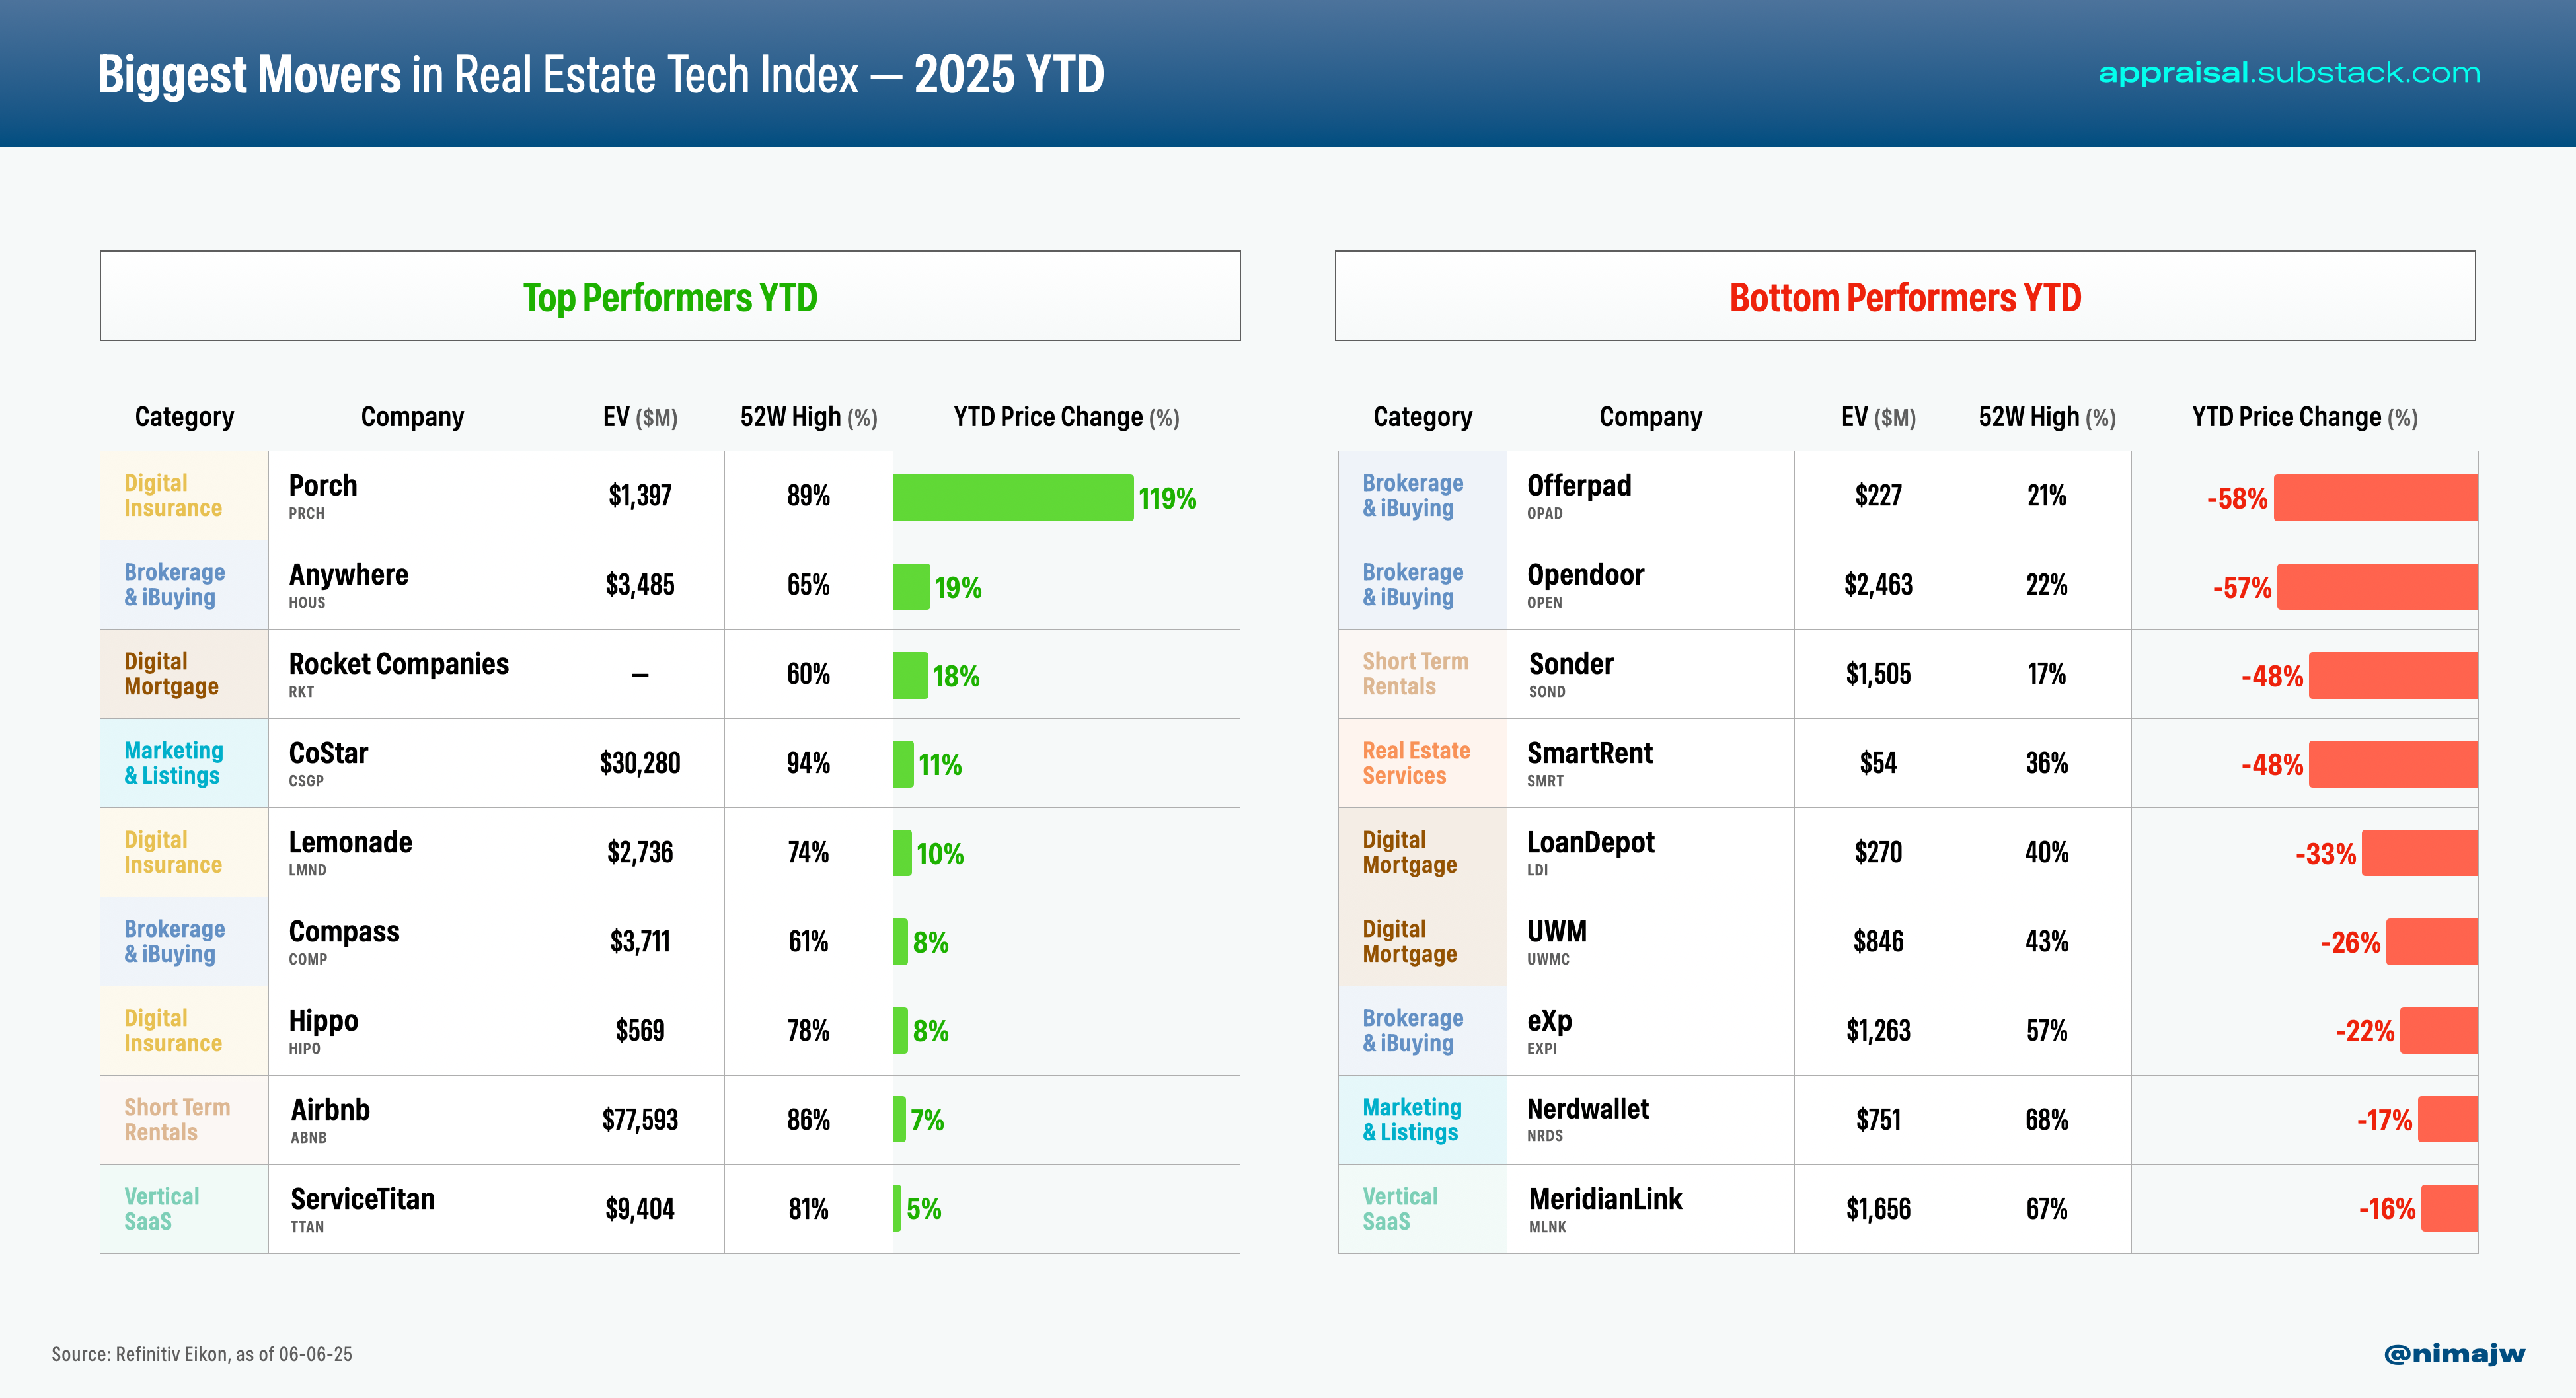
Of course, the Index represents aggregate returns, and we’ve seen a wide dispersion of outcomes at the individual company level. Some have remained resilient within a tough macro (Compass and Lemonade are up 75% and 149%, respectively, over the last year), while others have struggled to sustain durable growth and profitability (Opendoor is down 68% over the last year and is planning a reverse stock split to avoid a Nasdaq delisting).
In my inaugural newsletter, I highlighted three primary headwinds facing companies in the Index: a challenging macro environment, a SPAC wave that brought dozens of companies public prematurely, and shifting investor appetite from “growth at all costs” towards profitable growth.
Several companies have struggled to navigate these headwinds — since launching the Index about three years ago, six companies have been taken private or delisted (Doma, Latch, Matterport, Redfin, Vacasa and WeWork). I’ve written previously about consolidation in proptech, including Rocket’s recent acquisition of Redfin (since that post, Rocket also announced its acquisition of Mr. Cooper, the country’s largest mortgage servicer). Should we expect further M&A activity heading into the second half of 2025? I’ve compiled several data points below that give us a sense of where we are in the real estate cycle and how investor sentiment may evolve in the coming quarters.
Housing Supply
The COVID-era housing market was dominated by low cost capital and very tight housing supply — leading to a supply-demand imbalance that drove home prices up by 40%+ in most markets. Now, housing supply has increased significantly, with for-sale inventories growing on a year-over-year basis for 17 straight months.
According to Redfin, home sellers in the U.S. are sitting on $700 billion of unsold housing stock, the highest dollar amount ever. For-sale inventory is at a five-year high and 44% of listings have been on the market for over 60 days, the highest share since 2020.
Home price growth is now decelerating in 100% of the top 100 MSAs in the country. 25% of these MSAs are now seeing home prices decline on a YoY basis, up from just 5% one year ago.
Mortgage Rates and Housing Demand
The housing market remains paralyzed by high mortgage rates, which rose back to 7% in the aftermath of President Trump’s announcement of a new global tariff regime.
The disparity between pre-COVID and post-COVID homebuyers is striking — a typical homebuyer in 2018 now spends about 9% of their household income on housing, whereas a median buyer in 2024 pays more than 25% of their income on housing payments. Persistently high rates, without a reset of homes prices, is leaving many buyers on the sidelines.
The Federal Reserve is widely expected to keep its benchmark interest rate flat when the central bank's policy committee meets this week. The Fed appears to be in a wait-and-see mode as it watches for clearer signals about the path of the economy. Inflation is especially difficult to predict because tariffs may change the picture, but it’s not yet clear by how much. JP Morgan’s forecast puts the Fed Funds Rate at ~3% by Jan 2026, and believes mortgage rates could drop to ~5.75% by year-end.
Inflation & Sentiment
There have been several encouraging inflation reports this year, suggesting we are closing in on the Fed’s 2% annual inflation target. In April, the Consumer Price Index rose 2.3% on an annual basis, reflecting the lowest level since February 2021. On a month-over-month basis, the CPI rose 0.2%, lighter than the 0.3% pace forecast by economists. The Truflation index has been below 2% for most of 2025.
U.S. consumer sentiment improved in June, easing fears that Trump’s trade policies triggered major economic disruption, though views on the economy remain uneasy. The University of Michigan’s preliminary index rose to 60.5 from May’s 52.2, marking its first increase in six months. Still, sentiment is down about 18% from December 2024, when post-election optimism peaked.
The NFIB released their Small Business Economic Trends Report for May, and their headline figure, the Small Business Optimism Index, climbed 3 points to 98.8, edging back above its long-run average.
The U.S. continued to add jobs at a steady pace in May, and the unemployment rate remained at 4.2% for the third straight month.
Commercial Real Estate Activity
Through Q1 2025, national transaction activity declined 11.6% quarter-over-quarter and 8.0% year-over-year (by property count). Total transaction volume reached $69.3 billion, down 22.3% from Q4 2024 and 19% from Q1 2024.
The CMBS delinquency rate has climbed to 11% in June, its highest since 2013. Office and retail assets make up the bulk of distressed loans, with office accounting for over 50% of total delinquencies.
Since my last update, there have been a number of transactions impacting companies in the Index; as such, I’ve made the following changes:
The “Real Estate Services” category has been removed — Matterport was acquired by CoStar and Latch has been delisted from Nasdaq.
Porch has been moved to the “Digital Insurance” category; property insurance-related revenue makes up more than 50% of the company’s total revenue.
SmartRent has been moved to the “Vertical SaaS” category. SaaS revenue makes up about one-third of the company’s total revenue and is actively shifting to a “hardware-enabled SaaS model.”
Vacasa was removed from the “Short Term Rentals” section; the company was acquired by Casago in April 2025 for $5.30 per share.
Redfin was removed from the “Brokerage & iBuying” category; the company was acquired by Rocket Companies in March 2025 for $12.50 per share.
ServiceTitan was added to the “Vertical SaaS” category; the company went public in December 2024. ICE was removed from the “Veritcal SaaS” category; while the company owns Ellie Mae and other mortgage software assets, its mortgage-related revenue makes up less than 20% of the company’s total revenue.
If you have any colleagues that may find The Appraisal valuable, please share this newsletter. Thank you!
Ten Trending Topics
In lieu of a deep dive this month I am sharing several great articles and podcasts I’ve consumed recently that cover proptech, housing and the broader real estate market. Going forward, I’ll try to share at least a handful of links in each newsletter.
AI to Drive 165% Increase in Data Center Power Demand by 2030 [Goldman Sachs] Good research piece on the unprecedented scale of demand for electricy, driven by data center development globally. In 2023, U.S. data centers used 176 TWh of electricity, which was 4.4% of total U.S. electricity consumption. This is expected to meaningfully increase by 2028, with projections suggesting a consumption of up to 580 TWh, or 12% of total U.S. electricity.
Wall St. Is All In on A.I. Data Centers. But Are They the Next Bubble? [NYT] Private equity giants like Blackstone have poured hundreds of billions into data centers to capitalize on the AI boom, with Blackstone alone investing over $100 billion in buying, lending to, and building data centers through its acquisition of Quality Technology Services (QTS). The piece highlights Blackstone’s vertical integration in the data center category — from ownership stakes in construction and equipment companies to deep relationships with tenants (the hyper-scalers and AI labs).
Trends Report — Artificial Intelligence [Bond Capital] Comprehensive (340-slide!) overview capturing the AI moment we are in from Mary Meeker at Bond Capital. What’s most striking is the scale of adoption and infrastructure buildout in AI — the big six are spending $212B annually on CapEx (63% year-over-year growth). This isn’t just “cloud 2.0” – it’s the biggest infrastructure buildout in tech history.
Invasion of the Home Humanoid Robots [NYT] Humanoid robotics firm 1X is teaching robots to mimic human motion with surprising dexterity. The humanoid robot industry has attracted $7.2 billion in investments since 2015. My last post on AI in Real Estate touched briefly on “physical AI” as an emerging category — this piece offers a glimpse into near-future use cases in logistics, property services, and assisted living.
Watch These Construction Robots 3D Print a Walmart Extension in Just Seven Days [Archinet] Alquist 3D successfully completed a 5,000-square-foot Walmart extension using robotic 3D printing technology in just seven days, which is six weeks faster than their previous warehouse project and required only five workers instead of the 25-30 typically needed for traditional construction. The project, completed two weeks ahead of schedule, utilized a pair of RIC-M1 Pro construction robots with a new Mobile-Rail design and custom tool heads that enabled continuous printing, demonstrating the commercial viability of large-scale robotic 3D construction for commercial structures.
Rent-Setting Algorithms Find Legal Lifeline [WSJ] A provision in the House Republicans' recently passed tax bill would prevent state and local governments from regulating AI and automated decision systems for 10 years, potentially nullifying dozens of local and statewide efforts to ban algorithmic rent-pricing systems like RealPage.
The U.S. Housing Market Has Nearly 500,000 More Sellers Than Buyers—the Most on Record [Redfin] According to Redfin data, the U.S. housing market currently has nearly 500,000 more sellers than buyers (34% more sellers than buyers), the largest imbalance on record dating back to 2013, which is expected to cause home prices to drop 1% by the end of 2025. This buyer's market is particularly pronounced in Miami, where sellers outnumber buyers by nearly 3 to 1, and in the condo market, where there are 83% more sellers than buyers.
Real Estate Giants Wage War Over Coveted Private Listings [SF Standard] Two companies on our index — Zillow and Compass — are engaged in a battle over "private exclusive" real estate listings, with Zillow announcing that by the end of the month, any home listed as a private exclusive will no longer appear on its platform. Compass currently advertises more than 100 private listings in San Francisco alone, which are only available to their clients and not publicly distributed through multiple listing service (MLS) databases, creating tension in the industry as critics argue this practice restricts the market and allows Compass to double its commissions by representing both sides of transactions.
Voice AI is Working. Here’s Where It Wins First [NFX Blog] Venture firm NFX has a great piece about emerging voice AI use cases across a number of sectors, including home services, construction and real estate. I’ve seen a number of early stage companies building vertical voice AI solutions (several were featured on my top 50 list last month). These platforms can respond to customer calls and messages 24/7, with high accuracy at a fraction of the cost of human receptionists.
The Billionaire Behind Japan’s Art Islands Has One Final Jewel in His Crown [NYT] Naoshima, a tiny Japanese island, has become a global cultural destination thanks to many museums designs by architect Tadao Ando—highlighting the powerful interplay between art, space, and place-making. A tenth museum was recently opened on the island — worth visiting if you are traveling to Japan this year!
Thanks for reading! As always, please feel free to share feedback or thoughts on this newsletter — you can respond to this email directly or shoot me a note at nima@thomvest.com.
Note: Charts and graphs provided within are for informational purposes solely and should not be relied upon when making any investment decision. The content speaks only as of the date indicated. Any projections, estimates, forecasts, targets, prospects, and/or opinions expressed in these materials are subject to change without notice and may differ or be contrary to opinions expressed by others.